Session Agenda
Presentations
Notes
Hands On
Search
Menu
Presentations
Notes
Hands On
# Monitoring 101 <!-- .slide: data-state="titleslide" --> Note: This is a speaker note --- <!-- .slide: data-background-image="../../images/monitoring101/rainondash.png" --> <!-- .slide: data-state="whitebackground" --> --- <!-- .slide: data-background-image="../../images/monitoring101/splat.png" --> <!-- .slide: data-state="whitebackground" --> --- # Collecting data is cheap <!-- .slide: data-transition="fade-out" --> --- <!-- .slide: data-transition="fade-in" --> # Collecting data is cheap <!-- .element: style="color: #bbb;" --> # **Not having it when you need it is expensive** --- <!-- .slide: data-background-image="../../images/monitoring101/blogseries.png" --> <!-- .slide: data-state="whitebackground" --> --- <!-- .slide: data-transition="none" --> <!-- .element: style="background: none; box-shadow: none; width: 100%" --> --- <!-- .slide: data-transition="none" --> <!-- .element: style="background: none; box-shadow: none; width: 100%" --> --- <!-- .slide: data-transition="none" --> <!-- .element: style="background: none; box-shadow: none; width: 100%" --> --- <!-- .slide: data-transition="none" --> 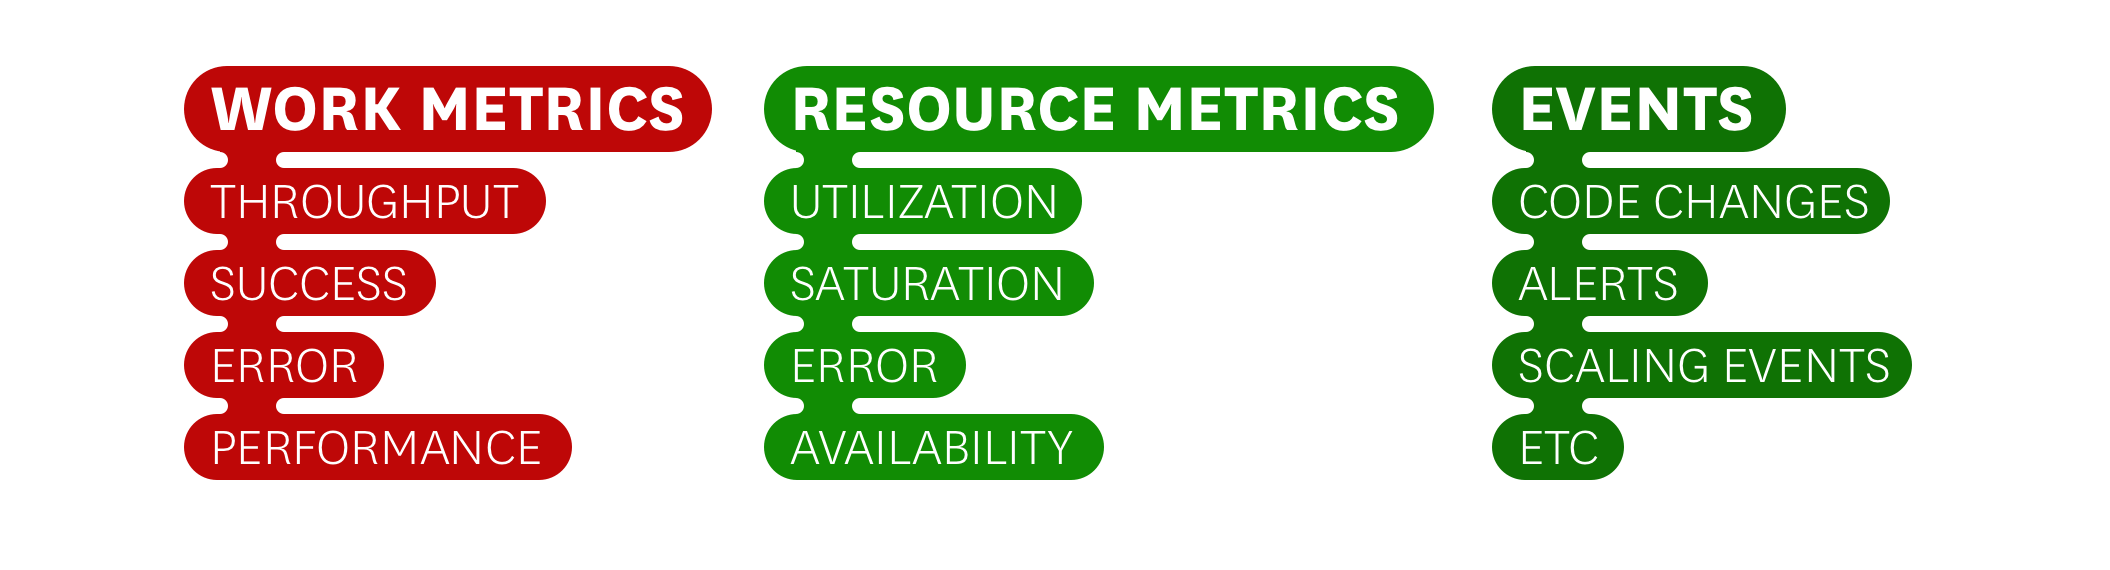<!-- .element: style="background: none; box-shadow: none; width: 100%" --> --- <!-- .slide: data-transition="none" --> <!-- .element: style="background: none; box-shadow: none; width: 100%" --> **Work - Throughput**: The server does something. <br>How many of those things did it do? --- <!-- .slide: data-transition="none" --> <!-- .element: style="background: none; box-shadow: none; width: 100%" --> **Work - Performance**: The server does something. <br>How long does it take to do those things? --- <!-- .slide: data-transition="none" --> <!-- .element: style="background: none; box-shadow: none; width: 100%" --> **Work - Success**: The server does something. <br>How many of those things were done successfully? --- <!-- .slide: data-transition="none" --> <!-- .element: style="background: none; box-shadow: none; width: 100%" --> **Work - Error**: The server does something. <br>How many of those things were not done successfully? --- <!-- .slide: data-transition="none" --> <!-- .element: style="background: none; box-shadow: none; width: 100%" --> **Resource - Utilization**: The server does something and relies on a resource. <br>How busy was the resource while the server did its thing? --- <!-- .slide: data-transition="none" --> <!-- .element: style="background: none; box-shadow: none; width: 100%" --> **Resource - Saturation**: The server does something and relies on a resource. <br>How long is the queue of things waiting for the server? --- <!-- .slide: data-transition="none" --> <!-- .element: style="background: none; box-shadow: none; width: 100%" --> **Resource - Error**: The server does something and relies on a resource. <br>How many errors is the resource experiencing with regards to the server? --- <!-- .slide: data-transition="none" --> <!-- .element: style="background: none; box-shadow: none; width: 100%" --> **Resource - Availability**: The server does something and relies on a resource. <br>How long is the resource available for? --- <!-- .slide: data-transition="none" --> <!-- .element: style="background: none; box-shadow: none; width: 100%" --> **Events - Code Changes**: You wrote the server and you updated the source code or configuration files.<br> --- <!-- .slide: data-transition="none" --> <!-- .element: style="background: none; box-shadow: none; width: 100%" --> **Events - Alerts**: The server that does something sent out an alert. --- <!-- .slide: data-transition="none" --> <!-- .element: style="background: none; box-shadow: none; width: 100%" --> **Events - Scaling Events**: The server got busy and scaled up or out. --- <!-- .slide: data-transition="fade-in" --> <!-- .element: style="background: none; box-shadow: none; width: 100%" --> --- <!-- .slide: data-transition="fade-in" --> 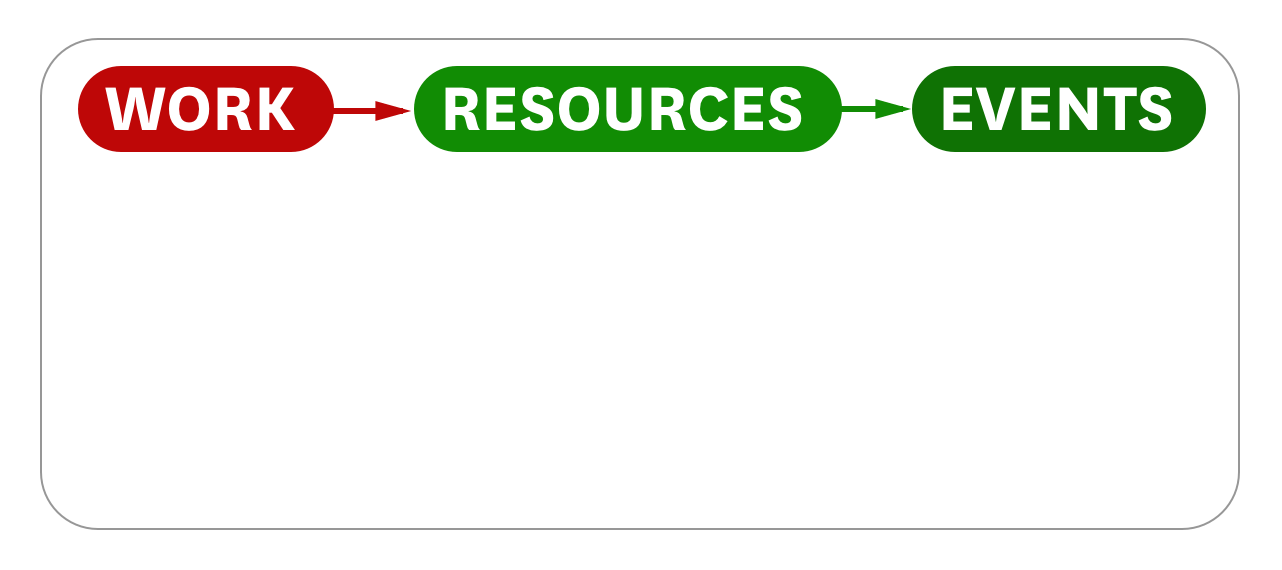<!-- .element: style="background: none; box-shadow: none; width: 100%" --> --- <!-- .slide: data-transition="none" --> 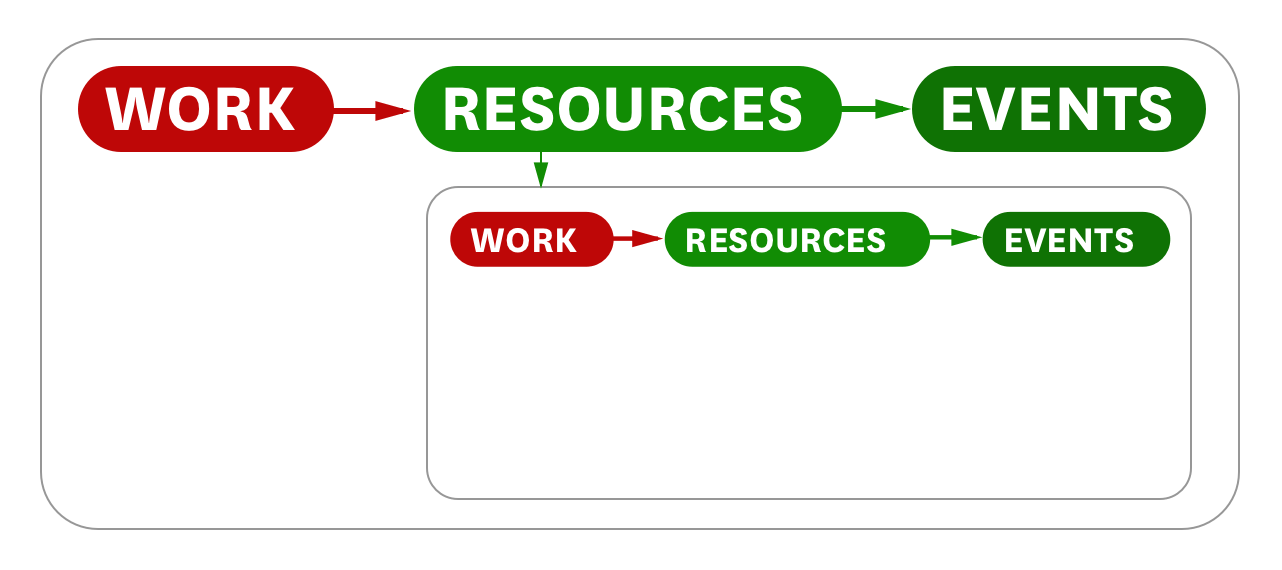<!-- .element: style="background: none; box-shadow: none; width: 100%" --> --- <!-- .slide: data-transition="none" --> 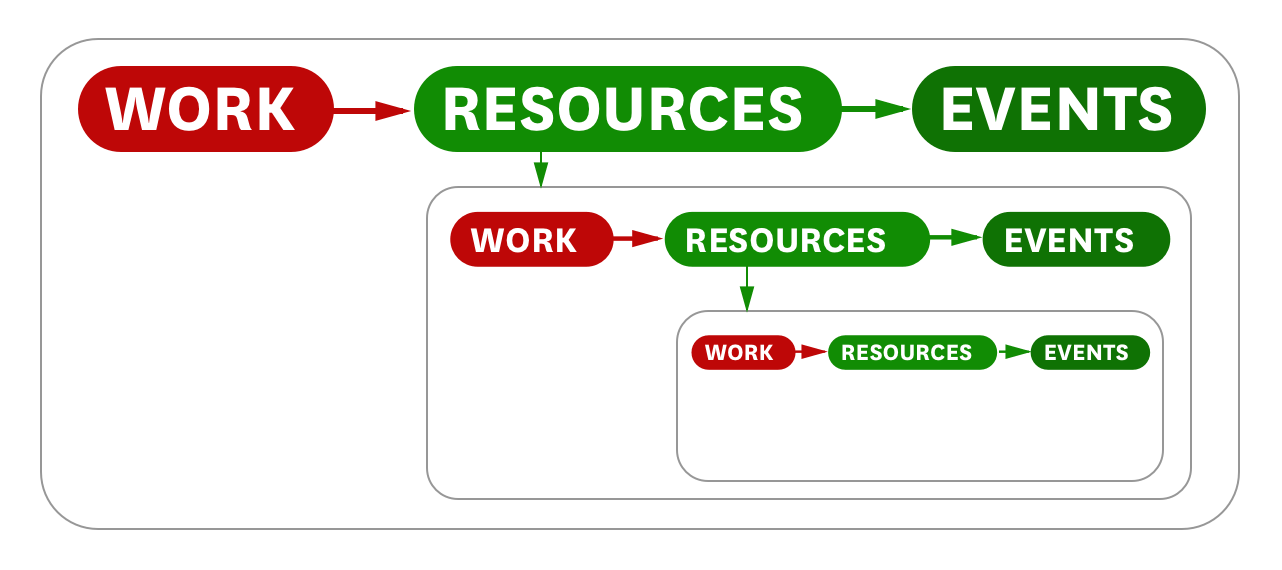<!-- .element: style="background: none; box-shadow: none; width: 100%" --> --- <!-- .slide: data-transition="none" --> 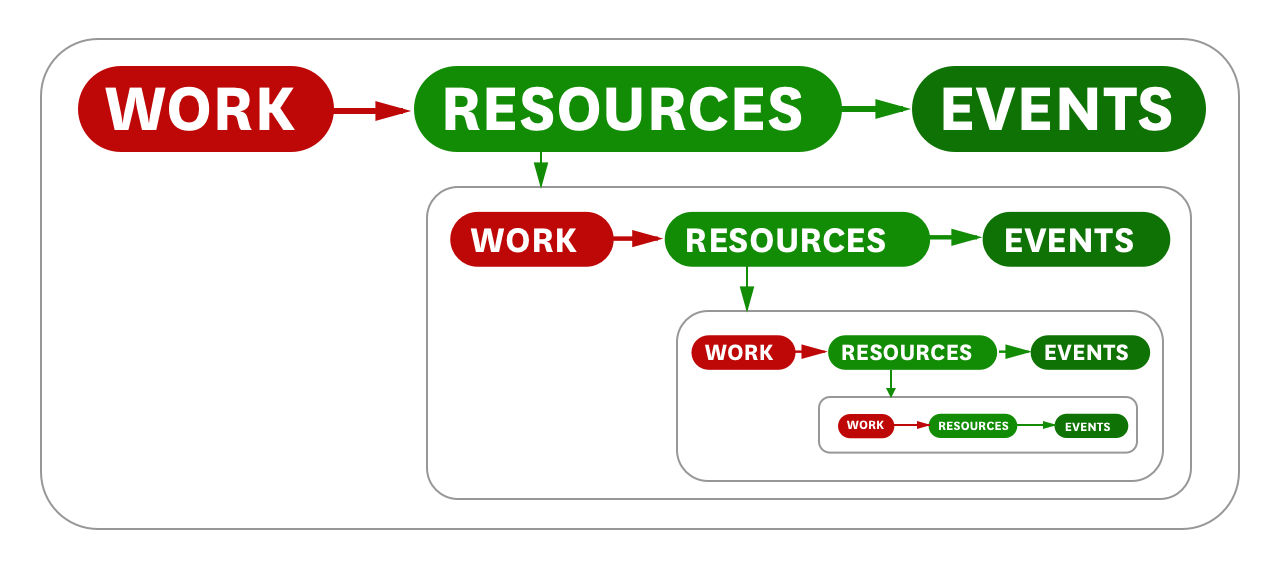<!-- .element: style="background: none; box-shadow: none; width: 100%" --> --- # Tags All the Way Down 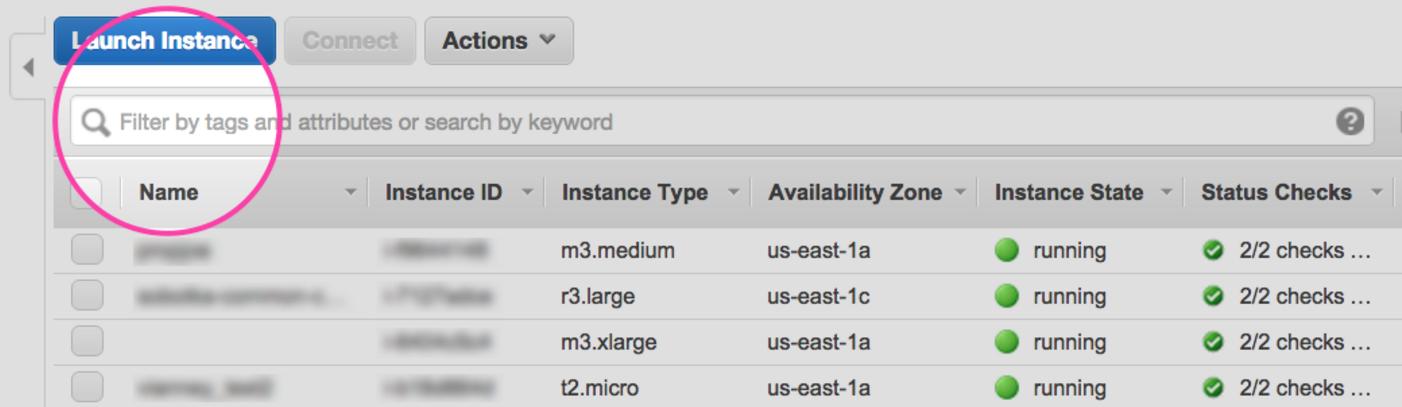<!-- .element: style="background: none; box-shadow: none; width: 100%" --> <!-- .slide: data-state="whitebackground" --> --- 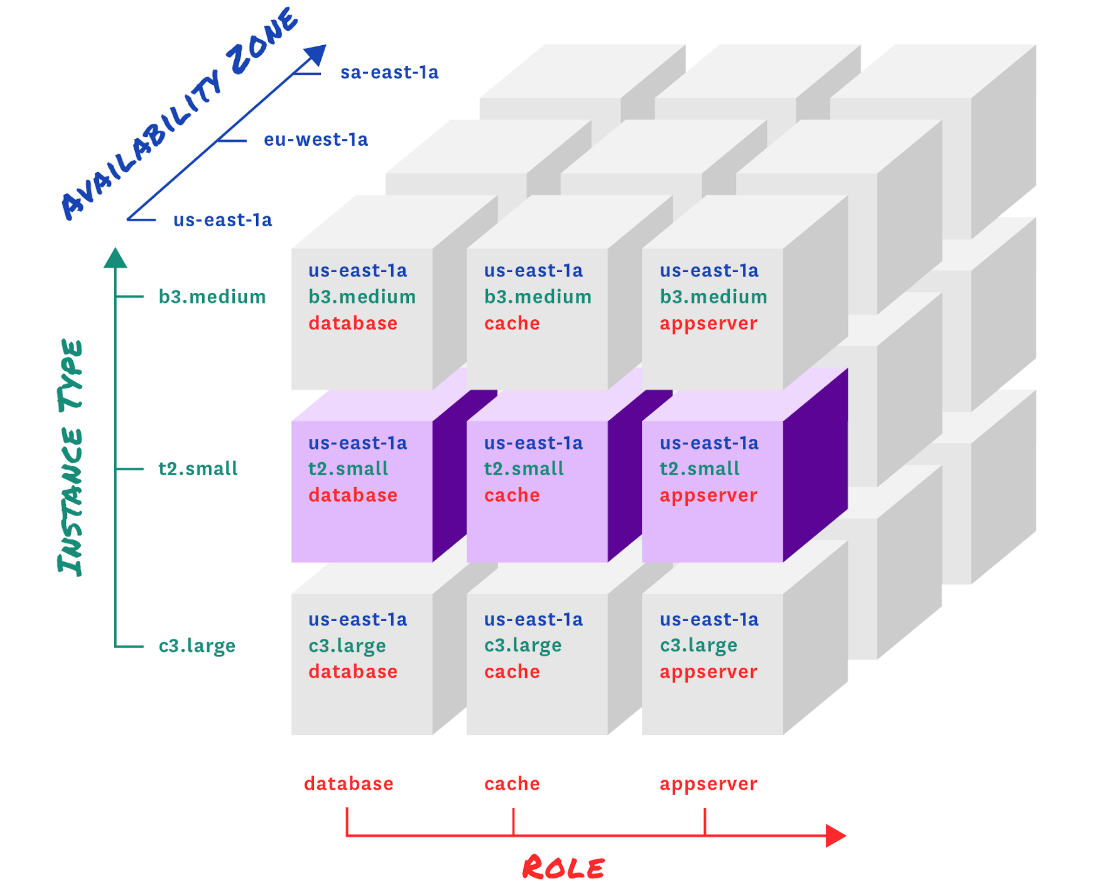<!-- .element: style="background: none; box-shadow: none; width: 79%" --> <!-- .slide: data-state="whitebackground" --> --- # Asking Better Questions 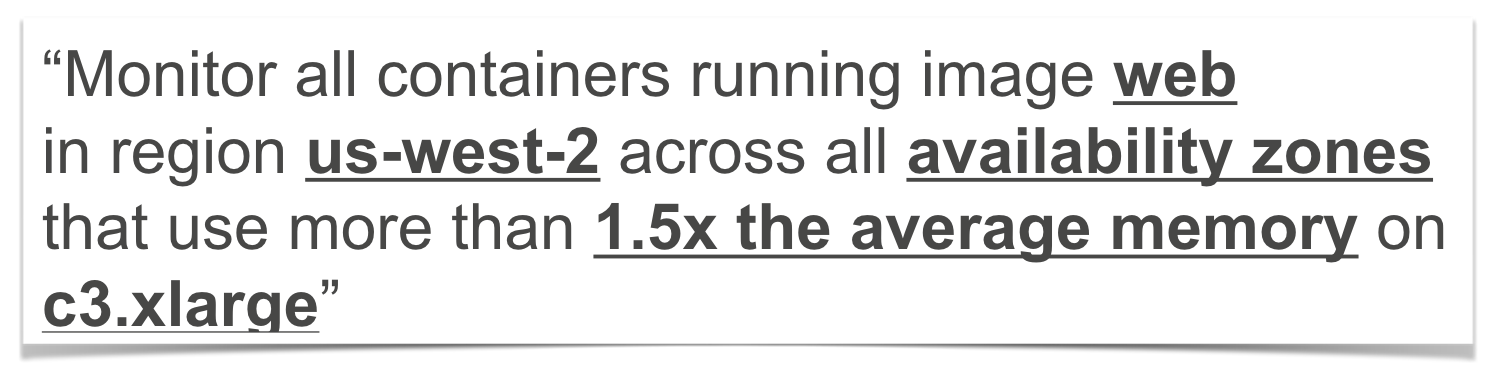<!-- .element: style="background: none; box-shadow: none; width: 100%" --> <!-- .slide: data-state="whitebackground" --> --- # Metric Graphs 101 ## Timeseries Graphs --- <!-- .slide: data-transition="fade-in" --> # Line Graphs 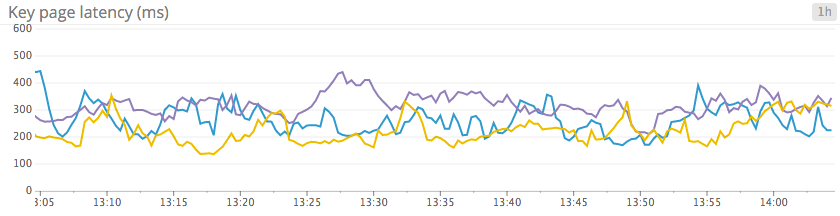<!-- .element: style="background: none; box-shadow: none; width: 100%" --> Note: Use Line Graphs for the same metric reported by diff scopes to spot outliers at a glance for tracking single metrics to see evolution over time related metrics with same units to see correlations metrics with clear acceptable domain --- <!-- .slide: data-transition="fade-in" --> # Stacked Area Graphs 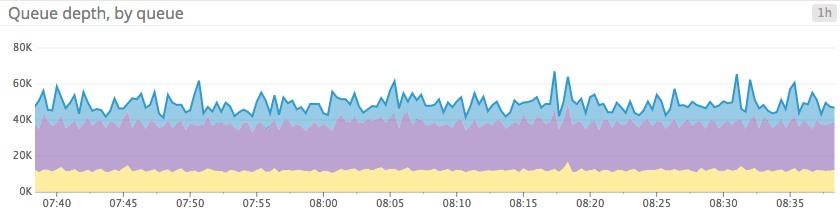<!-- .element: style="background: none; box-shadow: none; width: 100%" --> Note: Same metric from different scopes, to check both sum and contribution of each sum complementary metrics sharing the same unit If the metrics can't be added sensibly, don't use this --- <!-- .slide: data-transition="fade-in" --> # Bar Graphs 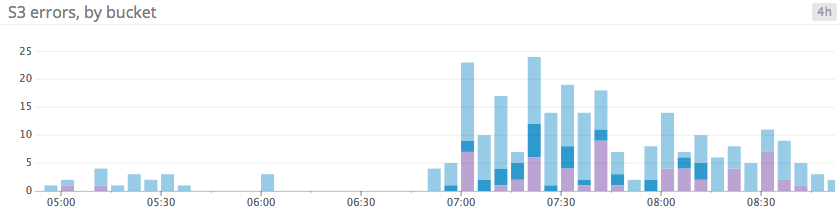<!-- .element: style="background: none; box-shadow: none; width: 100%" --> Note: use this for sparse metrics to convey values without jumpy or misleading interpolation metrics that represent a count and not a gauge --- <!-- .slide: data-transition="fade-in" --> # Heat Maps 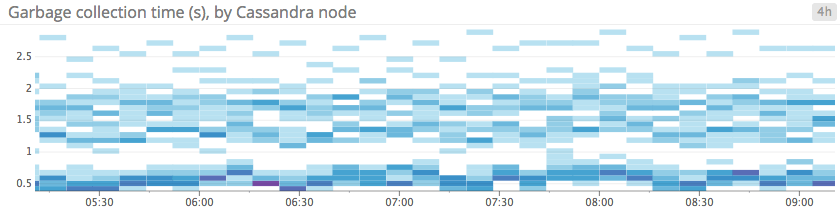<!-- .element: style="background: none; box-shadow: none; width: 100%" --> Note: single metrics reported by a large number of groups to see trends and variations across a group But if there are few sources, not so useful --- # Metric Graphs 101 ## Summary Graphs Visualizations that flatten a span --- <!-- .slide: data-transition="fade-in" --> # Aggregation Across Time 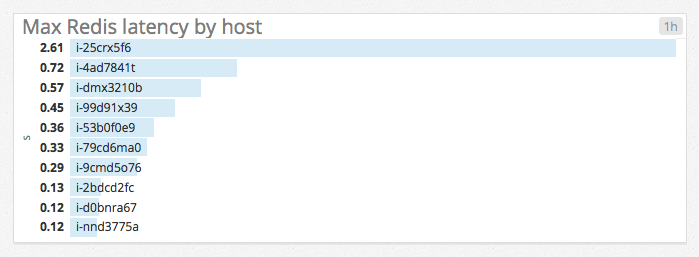<!-- .element: style="background: none; box-shadow: none; width: 100%" --> --- <!-- .slide: data-transition="fade-in" --> # Aggregation Across Space 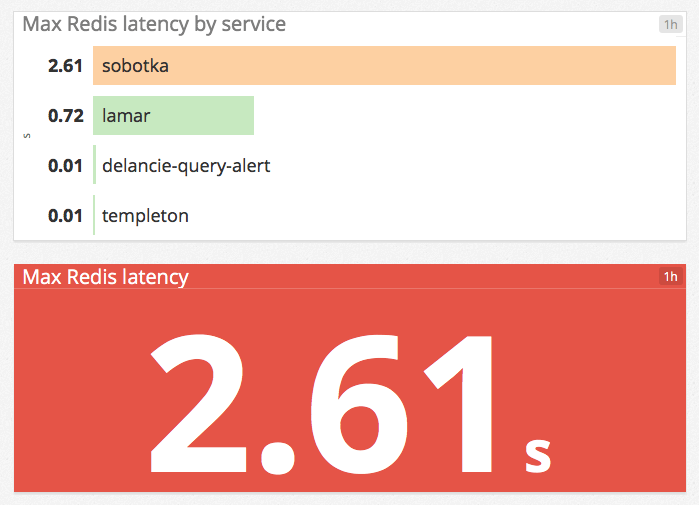<!-- .element: style="background: none; box-shadow: none; width: 80%" --> --- <!-- .slide: data-transition="fade-in" --> # Single Value Summary 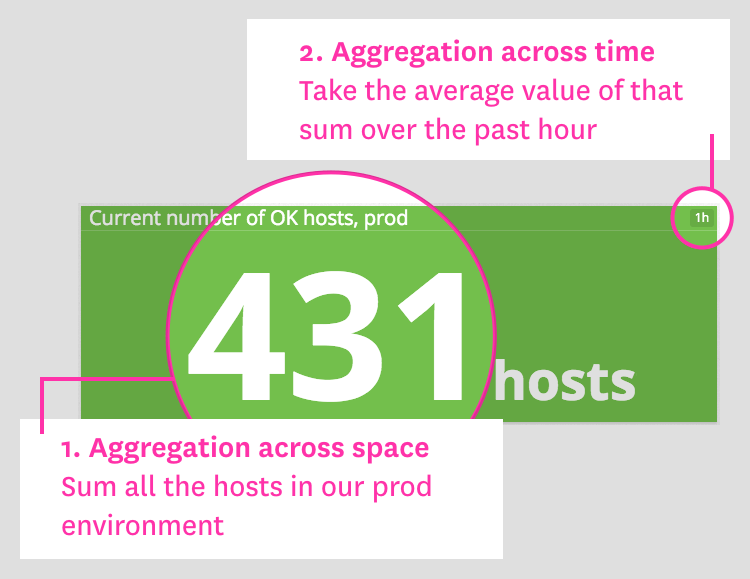<!-- .element: style="background: none; box-shadow: none; width: 70%" --> Note: work metrics from a given system to make them more visible critical resource metrics to provide overview at a glance error metrics to draw attention computed metric changes compared to previous value --- <!-- .slide: data-transition="fade-in" --> # Top Lists 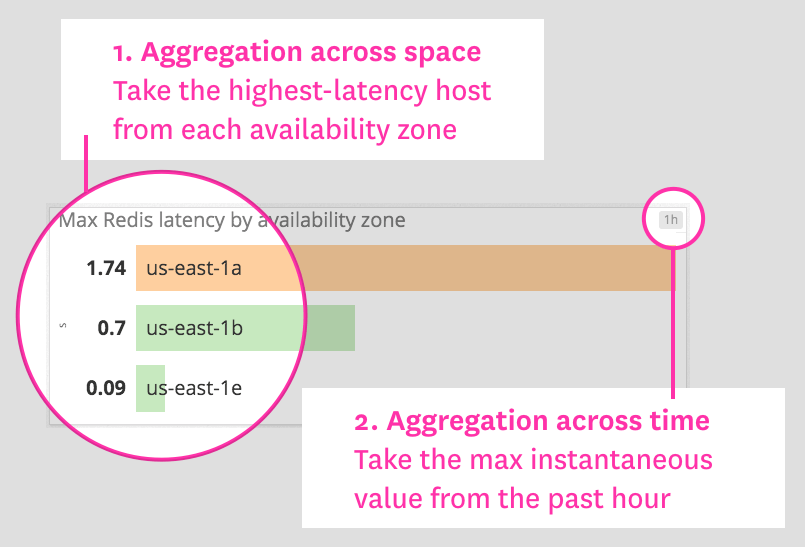<!-- .element: style="background: none; box-shadow: none; width: 70%" --> Note: work or resource metrics from different hosts or groups to spot outliers or overconsumers custom metrics to see kpis in a easy to read format --- <!-- .slide: data-transition="fade-in" --> # Change Graphs 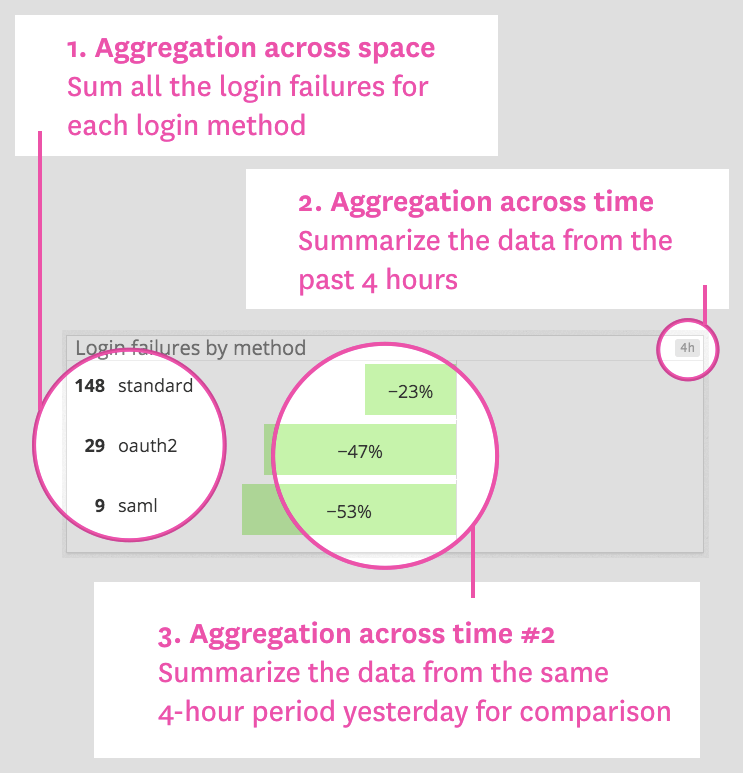<!-- .element: style="background: none; box-shadow: none; width: 50%" --> Note: cyclic metrics that rise and fall seasonally, to separate trends from periodic baselines high level infra metrics to spot large scale trends --- <!-- .slide: data-transition="fade-in" --> # Host Maps 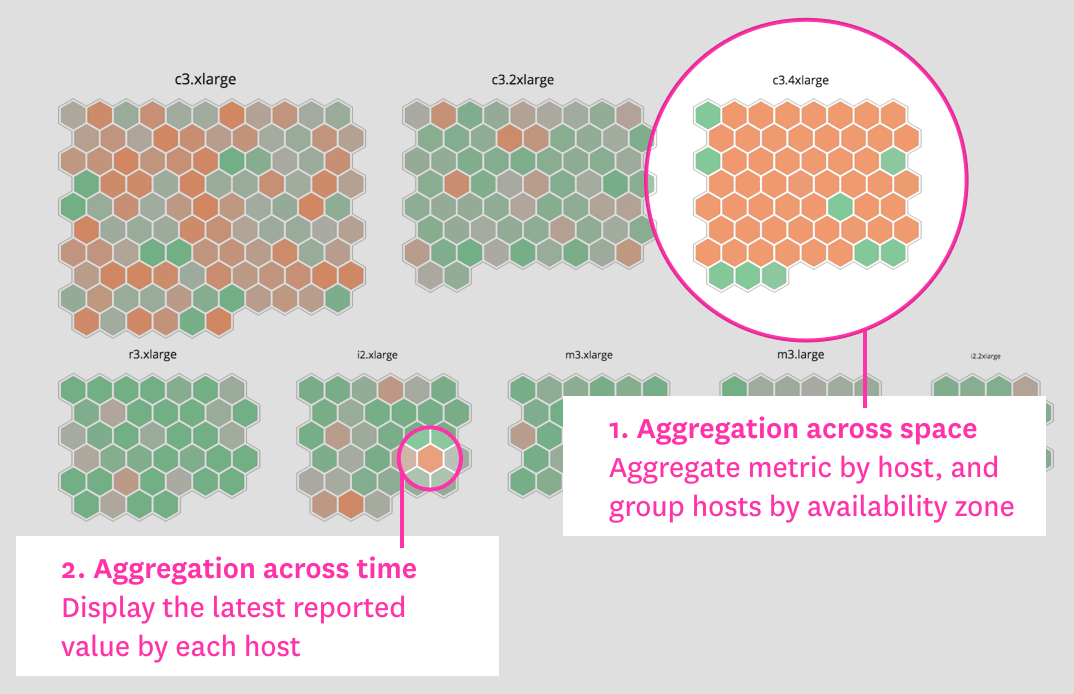<!-- .element: style="background: none; box-shadow: none; width: 70%" --> Note: resource utilization to spot overloaded components at a glance id resource misallocation id degraded hosts correlation in a single graph or related metrics --- <!-- .slide: data-transition="fade-in" --> # Distributions 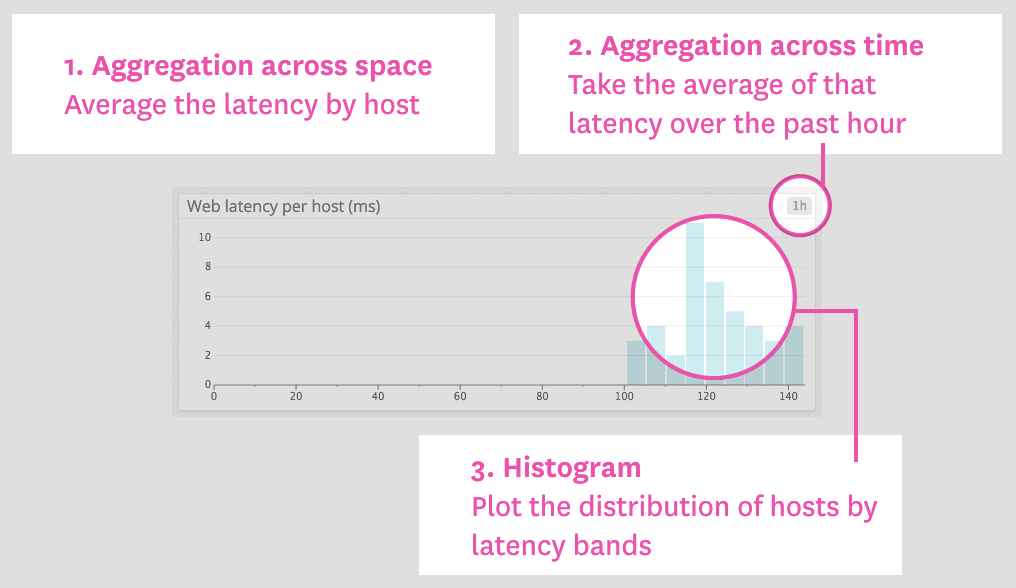<!-- .element: style="background: none; box-shadow: none; width: 70%" --> Note: single metric to see general health or variations across members of a group
Back to the Agenda
Notes
|
Hands On Instruction