Goroutine Scheduler
Note
The mental model presented here is intended to be as simple as possible, while still being useful to novice performance practitioners. In reality scheduling is a lot more complicated, so please consider studying More Information after this introduction.
HTTP Request Example
The Go runtime includes a scheduler that manages how your code is being executed on the CPUs of a system. Let’s learn about it using the example below:
func main() {
    res, err := http.Get("https://example.org/")
    if err != nil {
        panic(err)
    }
    fmt.Printf("%d\n", res.StatusCode)
}
Here we have a single goroutine, let’s call it G1, that runs the main function. Fig. 1. below shows a simplified timeline of how this goroutine might execute on a single CPU. Initially G1 is running on the CPU to prepare the http request. Then the CPU becomes idle as the goroutine has to wait for the network. And finally it gets scheduled onto the CPU again to print out the status code.
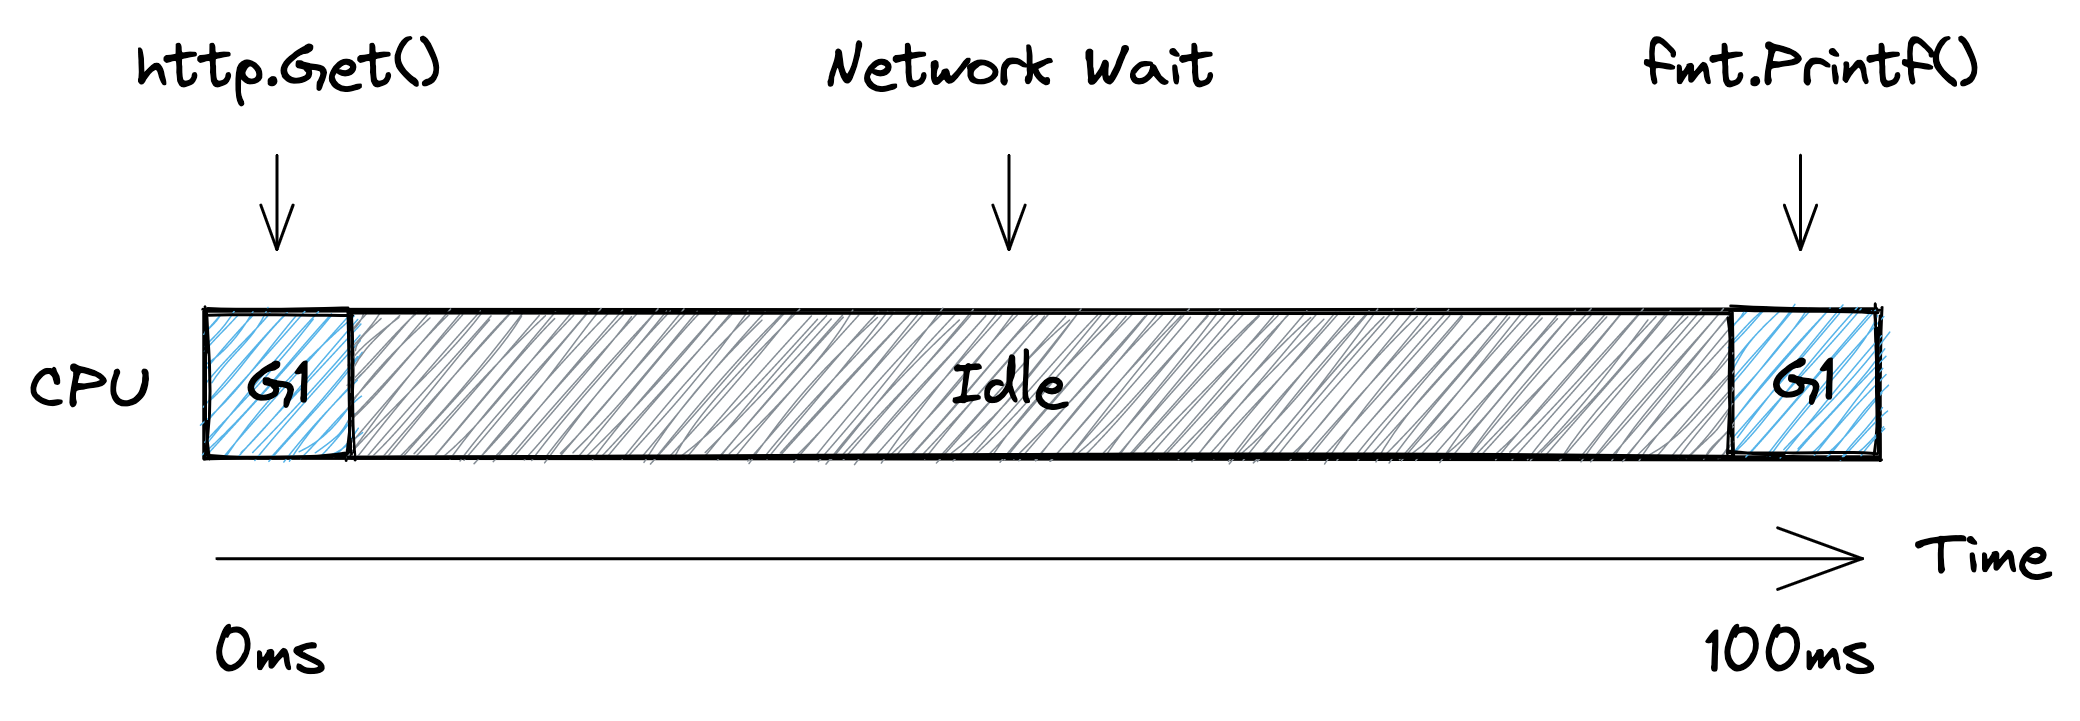
Fig. 1 Simplified timeline showing the execution of an http request.
From the scheduler’s perspective, the program above executes like shown in Fig. 2. At first G1 is Executing on CPU 1. Then the goroutine is taken off the CPU while Waiting for the network. Once the scheduler notices that the network has replied (using non-blocking I/O, similar to Node.js), it marks the goroutine as Runnable. And as soon as a CPU core becomes available, the goroutine starts Executing again. In our case all cores are available, so G1 can go back to Executing the fmt.Printf() function on one of the CPUs immediately without spending any time in the Runnable state.
Note
In reality Go is scheduling goroutines on virtual processors that have OS threads assigned to them. From there on it’s turtles all the way down, and it’s actually the OS that schedules the threads on hardware threads that are scheduled by the CPUs themselves. But the truth is out there, so you should seek More Information.
Full Example
Most of the time, Go programs are running multiple goroutines, so you will have a few goroutines Executing on some of the CPU cores, a large number of goroutines Waiting for various reasons, and ideally no goroutines Runnable unless your program exhibits very high CPU load. An example of this can be seen in Fig. 3 below.
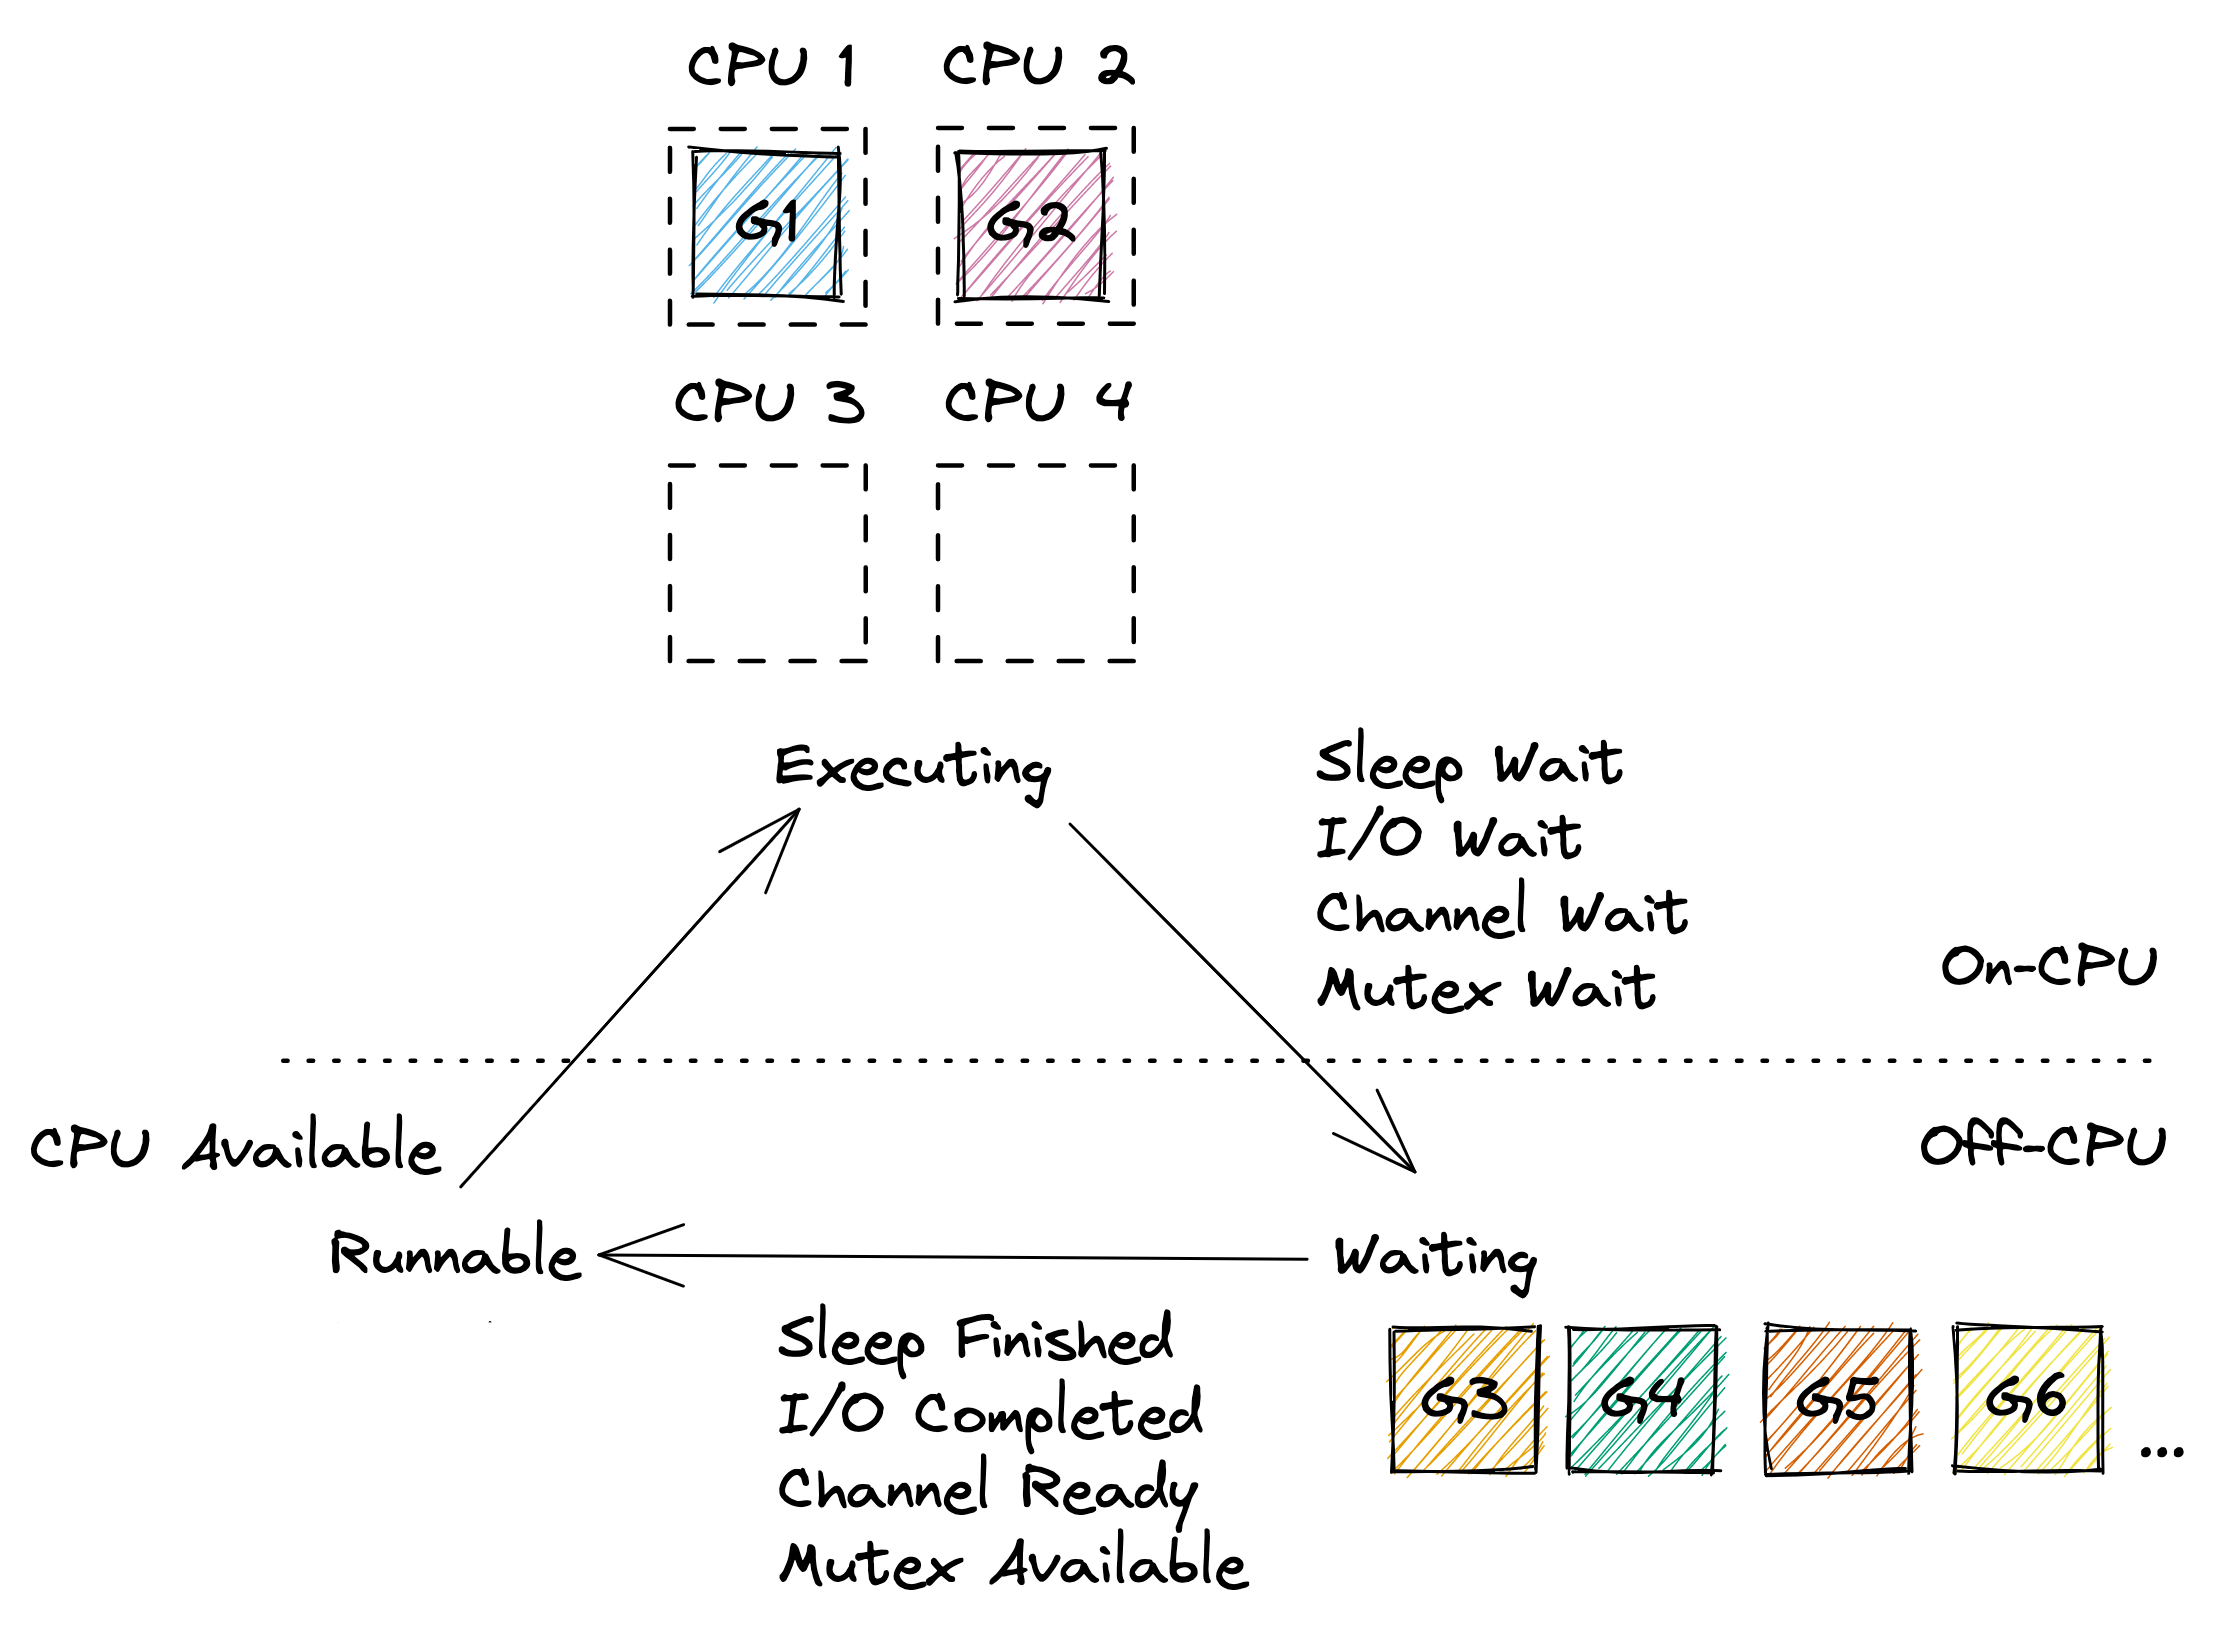
Fig. 3 Several goroutines in various scheduling states and the transitions events between them.
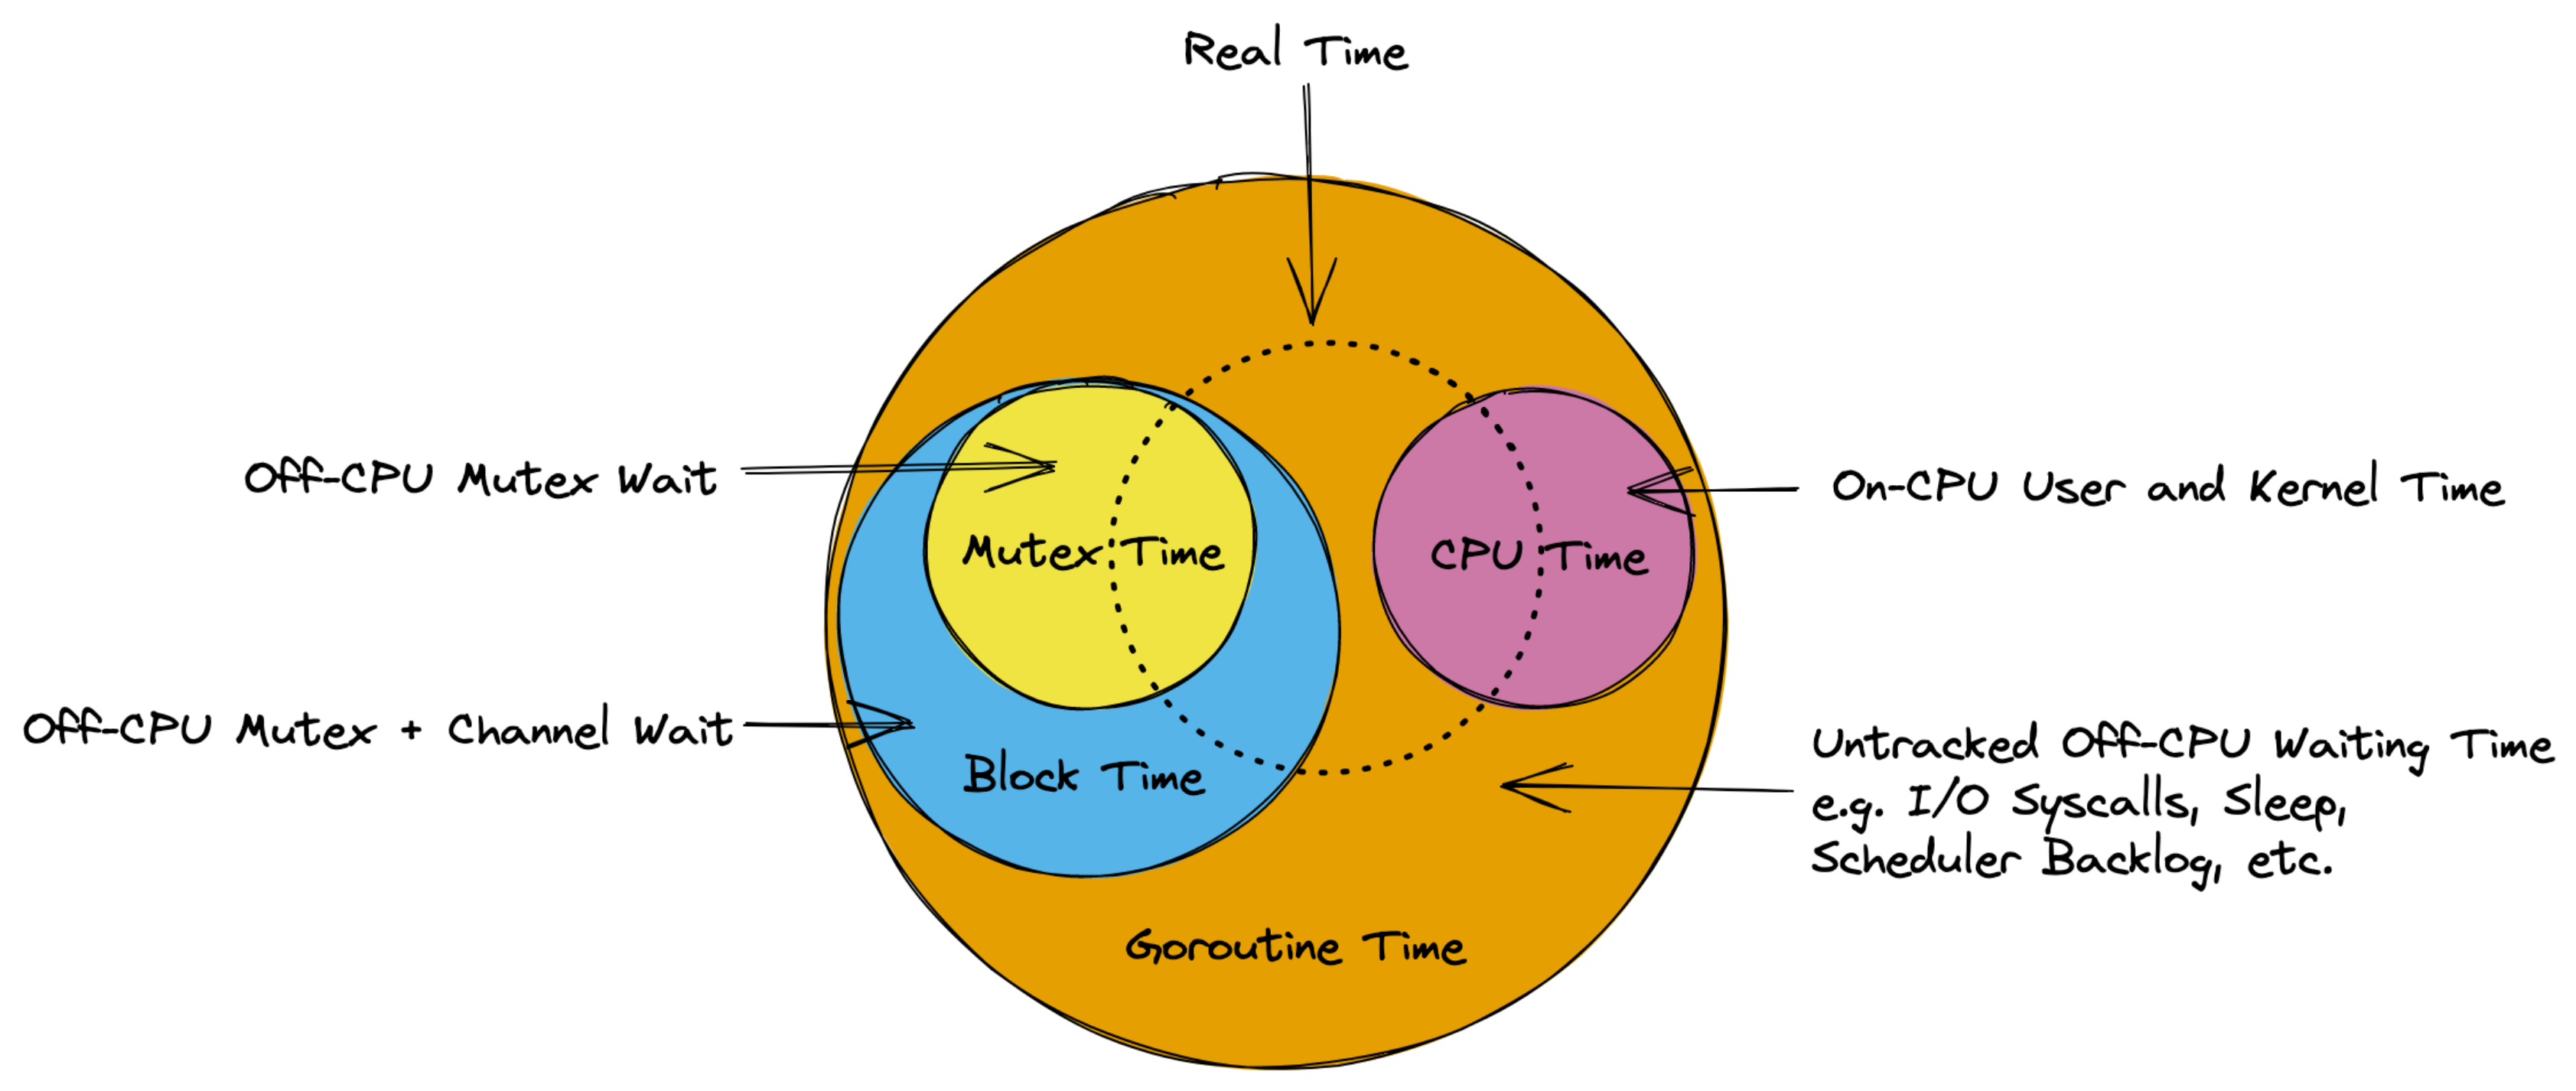
Profiling Time
Using the model above, we can now understand the output of time based Profiling in Go. As illustrated by Fig. 4, CPU Time is the time goroutines spent in the Executing state, while mutex and block time is happening in channel or mutex Waiting states. Additionally there are Waiting states that are not covered by any profilers (e.g. I/O). And if there is more than one goroutine, the total amount of goroutine time will exceed the real time experienced by a user.
More Information
For more detailed information, check out the resources below.
- Video: Go scheduler: Implementing language with lightweight concurrency (2019)
Fantastic presentation by Dmitry Vyukov at Hydra 2019 – highly recommended.
- Scheduling In Go (2018)
Three part series from William Kennedy with in-depth information on OS and Go scheduling.