CPU Profiler
Go’s CPU profiler can help you identify which parts of your code base consume a lot of CPU time.
Note
CPU time is different from the real time experienced by your users (aka latency). For example a typical http request might take 100ms to complete, spending 5ms of time On-CPU while waiting for 95ms on a database. It’s also possible for a request to take 100ms, but spend 200ms of CPU if two goroutines are performing CPU intensive work in parallel. If this is confusing to you, please read about the Goroutine Scheduler.
API
You can control the CPU profiler via various APIs:
Using the pprof StartCPUProfile and StopCPUProfile API.
file, _ := os.Create("./cpu.pprof")
pprof.StartCPUProfile(file)
defer pprof.StopCPUProfile()
Passing the
-cpuprofileoption togo test.go test -cpuprofile cpu.pprofVia the
net/http/pprofpackage.package main import ( "net/http" _ "net/http/pprof" ) func main() { http.ListenAndServe("localhost:1234", nil) }
This allows you to fetch e.g. a 10s CPU profile using the pprof tool over http:
go tool pprof http://localhost:1234/debug/pprof/profile?seconds=10
Control the sampling rate using SetCPUProfileRate.
runtime.SetCPUProfileRate(200) // 200 Hz, default is 100
This needs to be called before StartCPUProfile, see Limitations. To avoid overhead and observer effects, it’s usually best to use longer observation windows with the default sampling rate than shorter windows with higher sampling rates.
Use SetCgoTraceback to get stack traces for cgo code.
import _ github.com/benesch/cgosymbolizer
Importing benesch/cgosymbolizer registers a SetCgoTraceback for macOS and Linux.
Record the individual CPU profile samples into a runtime/trace (since Go 1.19).
file, _ := os.Create("./trace.trace")
trace.Start(file)
defer trace.Stop()

pprof.StartCPUProfile(io.Discard)
defer pprof.StopCPUProfile()
See CL 400795 for more information.
Commercial: Use a 3rd party library such as dd-trace-go for continuous profiling in production.
Data
Regardless of how you activate the CPU profiler, the resulting profile will essentially be a table of stack traces formatted in the binary pprof format. A simplified version of such a table is shown below:
stack trace |
samples/count |
cpu/nanoseconds |
|---|---|---|
main;foo |
5 |
50000000 |
main;foo;bar |
3 |
30000000 |
main;foobar |
4 |
40000000 |
How It Works
The CPU profiler captures this data by asking the operating system to monitor the CPU usage of the application and sends it a SIGPROF signal for every 10ms of CPU time it consumes. The OS also includes time consumed by the kernel on behalf of the application in this monitoring. Since the signal deliver rate depends on CPU consumption, it’s dynamic and can be up to N * 100 where N is the number of logical CPU cores on the system and 100 is the default sampling rate per CPU second. When a SIGPROF signal arrives, Go’s signal handler captures a stack trace of the currently active goroutine, and increments the corresponding values in the profile. The cpu/nanoseconds value is currently directly derived from the sample count, so it is redundant, but convenient.
Profiler Labels
A cool feature of Go’s CPU profiler is that you can attach arbitrary key value pairs to a goroutine. These labels will be inherited by any goroutine spawned from that goroutine and show up in the resulting profile.
Let’s consider the example below that does some CPU work() on behalf of a user. By using the pprof.Labels and pprof.Do API, we can associate the user with the goroutine that is executing the work() function. Additionally the labels are automatically inherited by any goroutine spawned within the same code block, for example the backgroundWork() goroutine.
func work(ctx context.Context, user string) {
    labels := pprof.Labels("user", user)
    pprof.Do(ctx, labels, func(_ context.Context) {
        go backgroundWork()
        directWork()
    })
}
The resulting profile will include a new label column and might look something like this:
stack trace |
label |
samples/count |
cpu/nanoseconds |
|---|---|---|---|
main.backgroundWork |
user:bob |
4 |
50000000 |
main.backgroundWork |
user:alice |
2 |
20000000 |
main.work;main.directWork |
user:bob |
4 |
40000000 |
main.work;main.directWork |
user:alice |
5 |
30000000 |
Viewing the same profile with pprof’s Graph view will also include the labels as shown in Fig. 5.
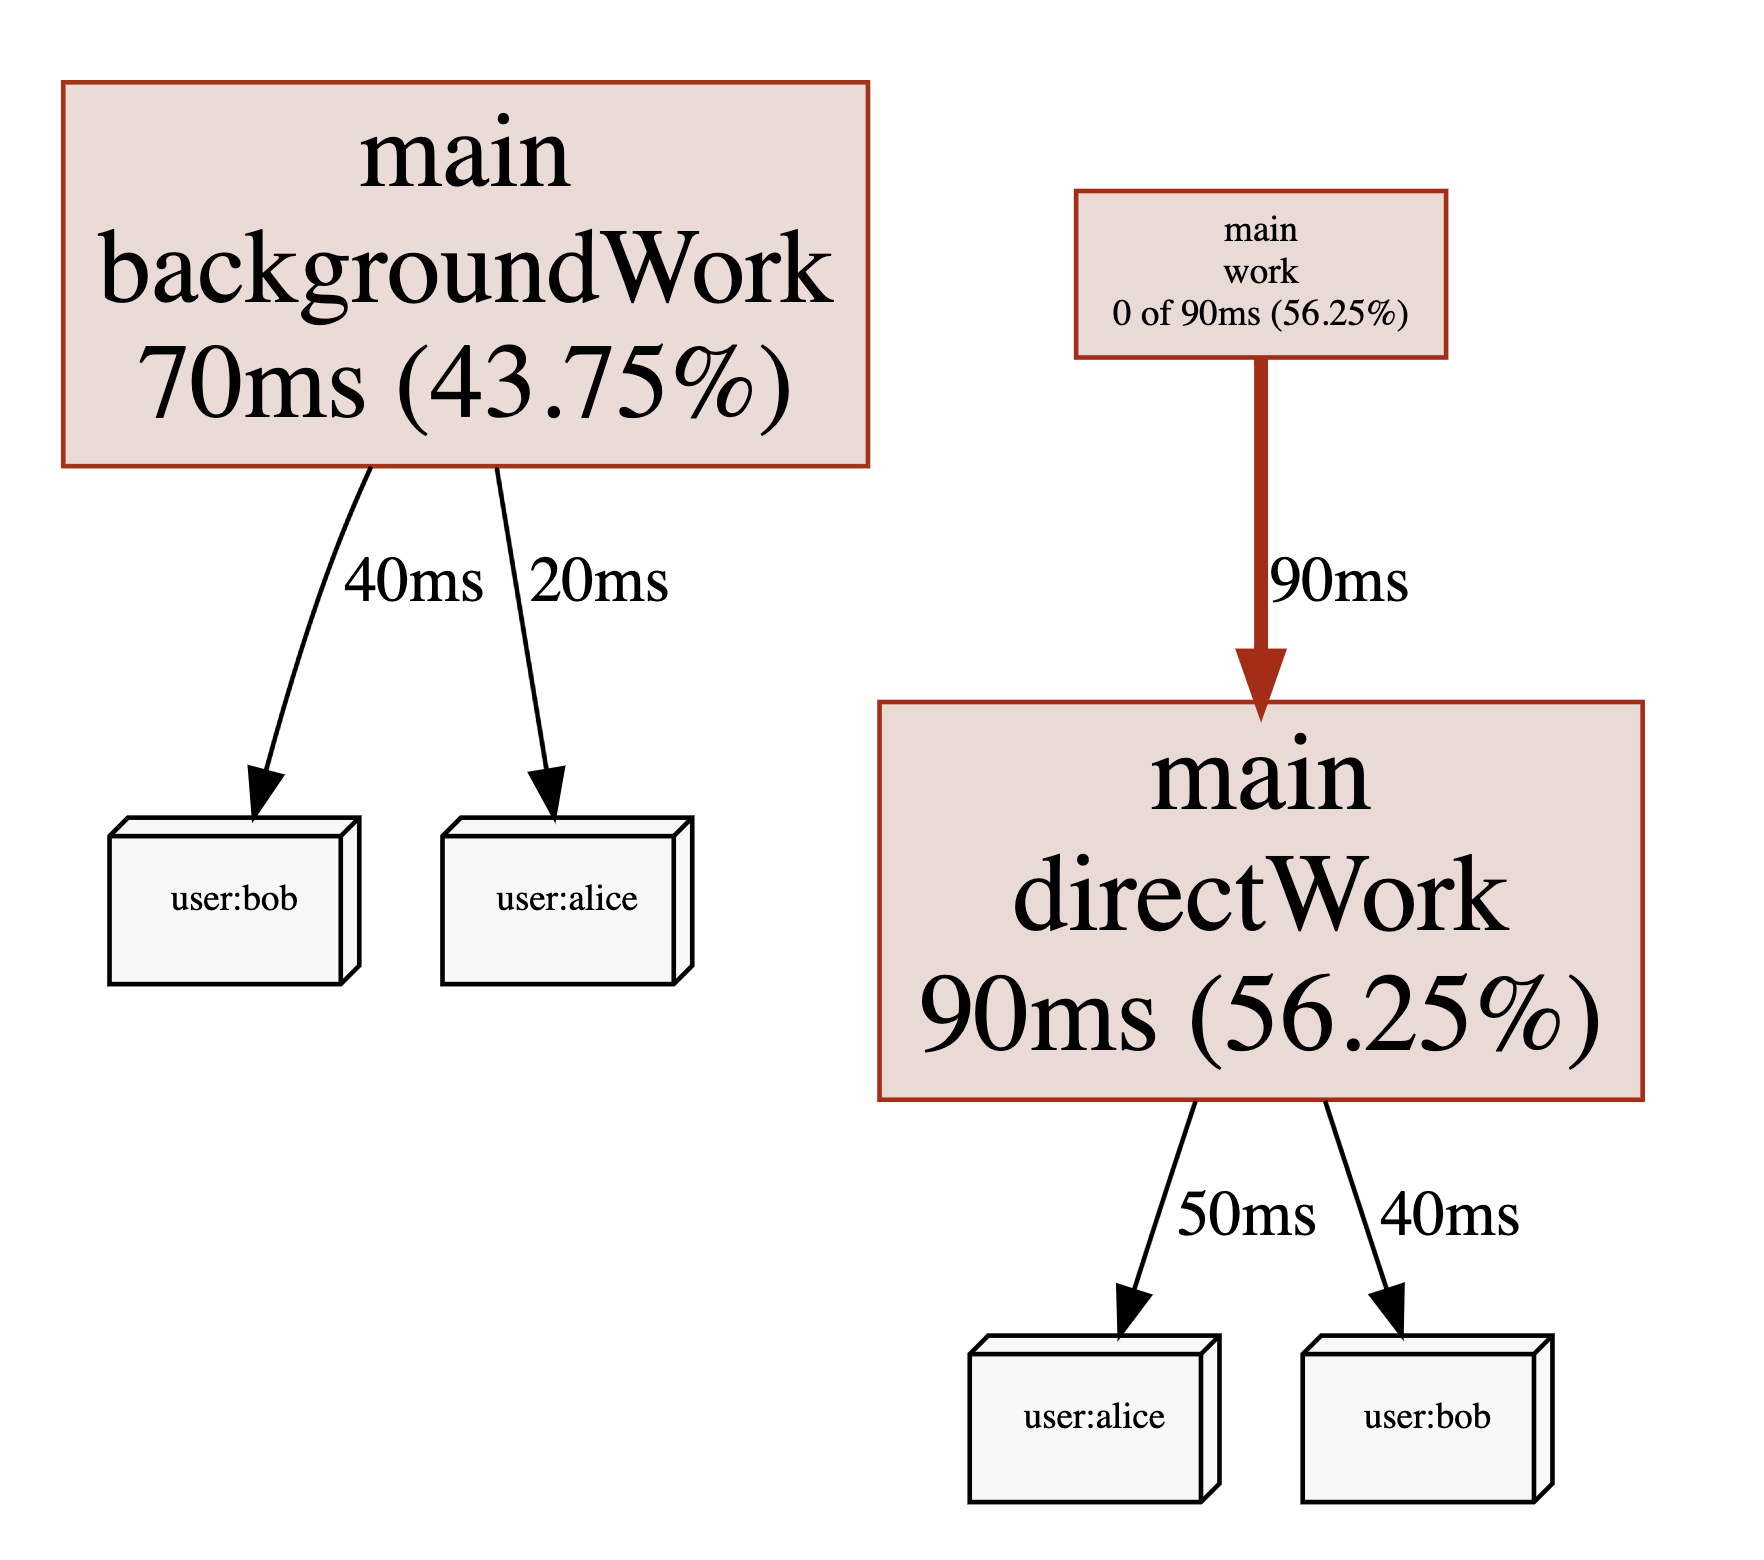
Fig. 5 pprof labels shown in the Graph view.
How you use these labels is up to you. You might include things such as user ids, request ids, http endpoints, subscription plan or other data that can allow you to get a better understanding of what types of requests are causing high CPU utilization, even when they are being processed by the same code paths. That being said, using labels will increase the size of your pprof files. So you should probably start with low cardinality labels such as endpoints before moving on to high cardinality labels once you feel confident that they don’t impact the performance of your application.
Commercial: Datadog supports Connecting Go Profiling With Tracing via pprof labels.
Warning
Go 1.17 and below contained several bugs that could cause some profiler labels to be missing from CPU profiles, see Limitations for more information.
CPU Utilization
Since the sample rate of the CPU profiler adapts to amount of CPU your program is consuming, you can derive the CPU utilization from CPU profiles. In fact pprof will do this automatically for you. For example the profile below was taking from a program that had an average CPU utilization of 147.77%:
$ go tool pprof guide/cpu-utilization.pprof
Type: cpu
Time: Sep 9, 2021 at 11:34pm (CEST)
Duration: 1.12s, Total samples = 1.65s (147.77%)
Entering interactive mode (type "help" for commands, "o" for options)
(pprof)
Another popular way to express CPU utilization is CPU cores. In the example above the program was using an average of 1.47 CPU cores during the profiling period.
Warning
In Go 1.17 and below you shouldn’t put too much trust in this number if it’s near or higher than 250%, see Limitations. However, if you see a very low number such as 10% this usually indicates that CPU consumption is not an issue for your application. A common mistake is to ignore this number and start worrying about a particular function taking up a long time relative to the rest of the profile. This is usually a waste of time when overall CPU utilization is low, as not much can be gained from optimizing this function.
System Calls in CPU Profiles
If you see system calls such as syscall.Read() or syscall.Write() using a lot of time in your CPU profiles, please note that this is only the CPU time spend inside of these functions in the kernel. The I/O time itself is not being tracked. Spending a lot of time on system calls is usually a sign of making too many of them, so perhaps increasing buffer sizes can help. For more complicated situations like this, you should consider using Linux perf, as it can also show you kernel stack traces that might provide you with additional clues.
Limitations
There are a few known issues and limitations of the CPU profiler that you might want to be aware of:
🐞 GH #35057: CPU profiles taken with Go versions <= 1.17 become somewhat inaccurate for programs utilizing more than 2.5 CPU cores. Generally speaking the overall CPU utilization will be underreported, and workload spikes may be underrepresented in the resulting profile as well. This is fixed in Go 1.18. Meanwhile you could try to use Linux perf as a workaround.
🐞 Profiler labels in Go versions <= 1.17 suffered from several bugs.
GH #48577 and CL 367200: Labels were missing for goroutines executing on the system stack, executing C code, or making system calls.
CL 369741: The first batch of samples in a CPU profile had an off-by-one error causing a misattribution of labels.
CL 369983: System goroutines created on behalf of user goroutines (e.g. for garbage collection) incorrectly inherited their parents labels.
⚠️ You can call SetCPUProfileRate to adjust the CPU profiler rate before calling StartCPUProfile. This will print a warning saying
runtime: cannot set cpu profile rate until previous profile has finished. However, it still works. This issue was initially raised here, and there is an accepted proposal for improving the API.⚠️ The maximum number of nested function calls that can be captured in stack traces by the CPU profiler is currently 64. If your program is using a lot of recursion or other patterns that lead to deep stack depths, your CPU profile will include stack traces that are truncated. This means you will miss parts of the call chain that led to the function that was active at the time the sample was taken.
More Information
For even more detailed information, check out the resources below.
- Inside the Go CPU profiler (2022)
A more in-depth look at the implementation details of the CPU profiler.
- Profiling Improvements in Go 1.18 (2022)
Discusses the recent switch from
setitimer(2)totimer_create(2)as well as improvements to pprof label recording.